Showing posts with label Financial Management. Show all posts

WHAT IS CAPEX? CAPEX BASIC INFORMATION AND TUTORIALS

What is CAPEX?

Short Answer
CAPEX stands for ‘Capital Expenditure’ and represents the amount of money spent for investments carried out from a long-term perspective.

Through the production process, fixed assets are used up. The annual depreciation charge is supposed to reflect this wearing out. By comparing capital expenditure with depreciation charges, you can determine whether the company is:

• Expanding its industrial base by increasing production capacity. In this case, capital expenditure is higher than depreciation as the company invests more than simply to compensate for the annual wearing out of fixed assets.

• Maintaining its industrial base, replacing production capacity as necessary. In this case, capital expenditure approximately equals depreciation as the company invests just to compensate for the annual wearing out of fixed assets.

• Under investing or divesting (capital expenditure below depreciation). This situation can only be temporary or the company’s future will be in danger, unless the objective is to liquidate the company.

Comparing capital expenditure with net fixed assets at the beginning of the period gives you an idea of the size of the investment program with respect to the company’s existing production facilities. A company that invests an amount equal to 50% of its existing net fixed assets is building new facilities worth half what it has at the beginning of the year. This strategy carries certain risks:

• that economic conditions will take a turn for the worse;
• that production costs will be difficult to control (productivity deteriorates);
• technology risks, etc.

The theoretical relationship between capital expenditures and the cash flow from operating activities is not simple. New fixed assets are combined with those already on the balance sheet, and together they generate the cash flow of the period.

Consequently, there is no direct link between operating cash flow and the capital expenditure of the period.

Thus, comparing cash flow from operating activities with capital expenditure makes sense only in the context of overall profitability and the dynamic equilibrium between sources and uses of funds.

The only reason to invest in fixed assets is to generate profits, i.e. positive cash flows. Any other objective turns finance on its head. You must therefore be very careful when comparing the trends in capital expenditure, cash flow, and cash flow from operating activities. This analysis can be done by examining the cash flow statement.

Any investment strategy must sooner or later result in an increase in cash flow from operating activities. If it doesn’t, then the investments are not profitable enough.

Be on the lookout for companies that grossly overinvest, despite their cash flow from operating activities not growing at the same rate as their investments. Management has lost sight of the all-important criterion that is profitability.

All the above does not mean that capital expenditure should be financed by internal sources only. Our point is simply that a good investment policy grows cash flow at the same rate as capital expenditure.

This leads to a virtuous circle of growth, a necessary condition for the company’s financial equilibrium, as shown in graph (a) of Figure 1.5 below. Graphs (b), (c) and (d) of Figure 1.5 illustrate other corporate situations. In (d), investment is far below the company’s cash flow from operations.


You must compare investment with depreciation charges in order to answer the following questions:

• Is the company living off the assets it has already acquired (profit generated by existing fixed assets)?

• Is the company’s production equipment ageing?

• Are the company’s current capital expenditures appropriate, given the rate of technological innovation in the sector?

Naturally, the risk in this situation is that the company is ‘resting on its laurels’, and that its technology is falling behind that of its competitors. This will eat into the company’s profitability and, as a result, into its cash flow from operating activities at the very moment it will mostly need cash in order to make the investments necessary to close the gap vis-`a-vis its rivals.

The most important piece of information to be gleaned from a cash flow statement is the relationship between capital expenditure and cash flow from operating activities and their respective growth rates.

Lastly, ask yourself the following questions about the company’s divestments. Do they represent recurrent transactions, such as the gradual replacement of a rental car company’s fleet of vehicles, or are they one-off disposals?

In the latter case, is the company’s insufficient cash flow forcing the company to divest? Or is the company selling old, outdated assets in order to turn itself into a dynamic, strategically rejuvenated company?

HOW TO BECOME A CFA CHARTER HOLDER?


The professional designation of Chartered Financial Analyst (CFA) is becoming a significant requirement for a career in investment analysis and/or portfolio management. For that reason, this section presents the history and objectives of the Association for Investment Management and Research (AIMR®) and general guidelines for acquiring the CFA designation. If you are interested in the program, you can write or email AIMR for more information.

The CFA examinations were first offered in 1963 by the Institute of Chartered Financial Analysts (ICFA) which was formed in 1959 to enhance the professionalism of those involved in various aspects of the investment decision-making process and to recognize those who achieve a high level of professionalism. The ICFA combined with the Financial Analysts Federation in 1990 to form AIMR.

AIMR’s mission is to advance the interests of the global investment community by establishing and maintaining the highest standards of education and professional practice. As applied to the CFA program, AIMR’s focus is:

• To develop and keep current a “body of knowledge” applicable to the investment decision-making process. The principal components of this knowledge are financial accounting, economics, both debt and equity securities analysis, portfolio management, ethical and professional standards, and quantitative techniques.

• To administer a study and examination program for eligible candidates, the primary objectives of which are to assist the candidate in mastering and applying the body of knowledge and to test the candidate’s competency in the knowledge gained.

• To award the professional CFA designation to those candidates who have passed three examination levels (encompassing a total of 18 hours of testing over a minimum of three years), who meet stipulated standards of professional conduct, and who otherwise are eligible for membership in AIMR.

• AIMR also provides a useful and informative program of continuing education through seminars, publications, and other formats that enable members, candidates, and others in the investment constituency to be more aware of and to better utilize the changing and expanding body of knowledge.

• Importantly, AIMR also sponsors and enforces a Code of Ethics and Standards of Professional Conduct that apply to enrolled candidates and to all members.


To enter the CFA program an applicant must have a bachelor’s degree (or the equivalent work experience). An applicant must receive a bachelor’s degree no later than December 31 of the current exam year in order to qualify for entrance.

A candidate may sit for all three examinations without having had investment experience per se or having joined a member society or chapter of AIMr. However, after passing the three examination levels, the

CFA Charter will not be awarded unless or until the candidate:

• has at least three years of experience as a financial analyst, which is defined as a person who has spent and/or is spending a substantial portion of his/her professional time collecting, evaluating, and applying financial, economic, and related data to the investment decision-making process; and

• has applied for membership or is a member of an affiliated member society or chapter of AIMR, if such a society/chapter exists within 50 miles of the candidate’s principal place of business.

The curriculum of the CFA study program covers:
1. Ethical and Professional Standards
2. Quantitative Techniques
3. Economics
4. Financial Statement Analysis
5. Corporate Finance
6. Analysis of Debt Investments
7. Analysis of Equity Investments
8. Analysis of Derivatives
9. Analysis of Alternative Investments
10. Portfolio Management
11. PERFORMANCE MEASUREMENT AND PRESENTATION

Members and candidates are typically employed in the investment field. From 1963 to May 2002, over 50,000 charters have been awarded. More than 100,000 individuals were enrolled in the 2002 CFA Candidate Program. If you are interested in learning more about the CFA Program, AIMR has a booklet that describes the program and includes an application form.

The address is: AIMR, Attn: Information Central, PO Box 3668, Charlottesville, Virginia, 22903, USA. You may also request a booklet by email to info@aimr.org.

REAL ASSETS VERSUS FINANCIAL ASSETS - WHAT'S THE DIFFERENCE?


The material wealth of a society is ultimately determined by the productive capacity of its economy, that is, the goods and services its members can create. This capacity is a function of the real assets of the economy: the land, buildings, machines, and knowledge that can be used to produce goods and services.

In contrast to such real assets are financial assets, such as stocks and bonds. Such securities are no more than sheets of paper or, more likely, computer entries and do not contribute directly to the productive capacity of the economy.

Instead, these assets are the means by which individuals in well-developed economies hold their claims on real assets. Financial assets are claims to the income generated by real assets (or claims on income from the government).

If we cannot own our own auto plant (a real asset), we can still buy shares in General Motors or Toyota (financial assets) and, thereby, share in the income derived from the production of automobiles.

While real assets generate net income to the economy, financial assets simply define the allocation of income or wealth among investors. Individuals can choose between consuming their wealth today or investing for the future. If they choose to invest, they may place their wealth in financial assets by purchasing various securities.

When investors buy these securities from companies, the firms use the money so raised to pay for real assets, such as plant, equipment, technology, or inventory. So investors’ returns on securities ultimately come from the income produced by the real assets that were financed by the issuance of those securities.

Household wealth includes financial assets such as bank accounts, corporate stock, or bonds. However, these securities, which are financial assets of households, are liabilities of the issuers of the securities. For example, a bond that you treat as an asset because it gives you a claim on interest income and repayment of principal from General Motors is a liability of General Motors, which is obligated to make these payments to you.

Your asset is GM’s liability. Therefore, when we aggregate over all balance sheets, these claims cancel out, leaving only real assets as the net wealth of the economy. National wealth consists of structures, equipment, inventories of goods, and land.

We will focus almost exclusively on financial assets. But you shouldn’t lose sight of the fact that the successes or failures of the financial assets we choose to purchase ultimately depend on the performance of the underlying real assets.

HOW DOES FINANCIAL RISK ARISE?


Risk provides the basis for opportunity. The terms risk and exposure have subtle differences in their meaning. Risk refers to the probability of loss, while exposure is the possibility of loss, although they are often used interchangeably. Risk arises as a result of exposure.

Exposure to financial markets affects most organizations, either directly or indirectly.When an organization has financial market exposure, there is a possibility of loss but also an opportunity for gain or profit. Financial market exposure may provide strategic or competitive benefits.

Risk is the likelihood of losses resulting from events such as changes in market prices. Events with a low probability of occurring, but that may result in a high loss, are particularly troublesome because they are often not anticipated. Put another way, risk is the probable variability of returns.


Since it is not always possible or desirable to eliminate risk, understanding it is an important step in determining how to manage it. Identifying exposures and risks forms the basis for an appropriate financial risk management strategy.

Financial risk arises through countless transactions of a financial nature, including sales and purchases, investments and loans, and various other business activities. It can arise as a result of legal transactions, new projects, mergers and acquisitions, debt financing, the energy component of costs, or through the activities of management, stakeholders, competitors, foreign governments, or weather.

When financial prices change dramatically, it can increase costs, reduce revenues, or otherwise adversely impact the profitability of an organization. Financial fluctuations may make it more difficult to plan and budget, price goods and services, and allocate capital.


There are three main sources of financial risk:

1. Financial risks arising from an organization’s exposure to changes in market prices, such as interest rates, exchange rates, and commodity prices

2. Financial risks arising from the actions of, and transactions with, other organizations such as vendors, customers, and counterparties in derivatives transactions

3. Financial risks resulting from internal actions or failures of the organization, particularly people, processes, and systems.


WHAT IS FINANCIAL RISK MANAGEMENT?

BASIC INFORMATION ON FINANCIAL RISK MANAGEMENT


Financial risk management is a process to deal with the uncertainties resulting from financial markets. It involves assessing the financial risks facing an organization and developing management strategies consistent with internal priorities and policies.

Addressing financial risks proactively may provide an organization with a competitive advantage. It also ensures that management, operational staff, stakeholders, and the board of directors are in agreement on key issues of risk.

Managing financial risk necessitates making organizational decisions about risks that are acceptable versus those that are not. The passive strategy of taking no action is the acceptance of all risks by default.

Organizations manage financial risk using a variety of strategies and products. It is important to understand how these products and strategies work to reduce risk within the context of the organization’s risk tolerance and objectives.

Strategies for risk management often involve derivatives. Derivatives are traded widely among financial institutions and on organized exchanges.

The value of derivatives contracts, such as futures, forwards, options, and swaps, is derived from the price of the underlying asset. Derivatives trade on interest rates, exchange rates, commodities, equity and fixed income securities, credit, and even weather.

The products and strategies used by market participants to manage financial risk are the same ones used by speculators to increase leverage and risk. Although it can be argued that widespread use of derivatives increases risk, the existence of derivatives enables those who wish to reduce risk to pass it along to those who seek risk and its associated opportunities.

The ability to estimate the likelihood of a financial loss is highly desirable. However, standard theories of probability often fail in the analysis of financial markets. Risks usually do not exist in isolation, and the interactions of several exposures may have to be considered in developing an understanding of how financial risk arises.

Sometimes, these interactions are difficult to forecast, since they ultimately depend on human behavior. The process of financial risk management is an ongoing one.Strategies need to be implemented and refined as the market and requirements change.

Refinements may reflect changing expectations about market rates, changes to the business environment, or changing international political conditions, for example. In general, the process can be summarized as follows:


• Identify and prioritize key financial risks.
• Determine an appropriate level of risk tolerance.
• Implement risk management strategy in accordance with policy.
• Measure, report, monitor, and refine as needed.

HIGH EMPLOYMENT: GOAL OF MONETARY POLICY


High employment, or a low rate of unemployment, is another key monetary policy goal. Unemployed workers and underused factories and machines lower output.

Unemployment causes financial distress and decreases self-esteem for workers who lack jobs. Congress and the president share responsibility for the goal of high employment.

Congress enacted the Employment Act of 1946 and the Full Employment and Balanced Growth Act of 1978 (the Humphrey-Hawkins Act) to promote high employment and price stability.

Although the Fed is committed to high employment, it does not seek a zero percent rate of unemployment. Even under the best economic conditions, some workers move into or out of the job market or are between jobs.

Workers sometimes leave one job to pursue another and might be unemployed in the meantime. Individuals also leave the labor force to obtain more education and training or to raise a family, and reentry may take time. This type of frictional unemployment enables workers to search for positions that maximize their well-being.

Structural unemployment refers to unemployment that is caused by changes in the structure of the economy, such as shifts in manufacturing techniques, increased use of computers, and increases in the production of services instead of goods. The tools of monetary policy are aimed at affecting economic conditions throughout the economy, so they are ineffective in reducing the levels of frictional and structural unemployment.

Instead, the Fed attempts to reduce levels of cyclical unemployment, which is unemployment associated with business cycle recessions. Sometimes economists have difficulty distinguishing structural unemployment from cyclical unemployment. For example, in 2010, some economists argued that while the high level of unemployment had a large cyclical component, structural unemployment might also have risen as the decline in the residential construction industry was expected to persist for a number of years.

How much an increase in structural unemployment was contributing to the high unemployment rate was unclear, however. When all workers who want jobs have them (apart from the frictionally and structurally unemployed) and the demand and supply of labor are in equilibrium, economists say that unemployment is at its natural rate (sometimes called the full-employment rate of unemployment).

Economists disagree on the exact value of the natural rate of unemployment, and there is good reason to believe that it varies over time in response to changes in the age and gender composition of the labor force and changes in government policies with respect to taxes, minimum wages, and unemployment insurance compensation.

Currently, most economists estimate that the natural rate of unemployment is between 5% and 6%, or far below the 9.6% unemployment rate the U.S. was experiencing in October 2010.

MONETARY POLICY TOOLS AND THE FEDERAL FUNDS RATE BASIC INFORMATION


Until the financial crisis of 2007–2009, the Fed primarily relied on three monetary policy tools. During the financial crisis, the Fed announced several new policy tools. In the fall of 2010, two of these new policy tools were still active.We first consider the Fed’s three traditional policy tools:

1. Open market operations. Open market operations are the Fed’s purchases and sales of securities in financial markets. Traditionally, the Fed concentrated on purchases and sales of Treasury bills, with the aim of influencing the level of bank reserves and short-term interest rates. During the financial crisis, the Fed began purchasing a wider variety of securities to affect long-term interest rates and to support the flow of credit in the financial system.

2. Discount policy. Discount policy includes setting the discount rate and the terms of discount lending. When Congress passed the Federal Reserve Act in 1913, it expected that discount policy would be the Fed’s primary monetary policy tool. The discount window is the means by which the Fed makes discount loans to banks, and serves as the channel to meet banks’ short-term liquidity needs.

3. Reserve requirements. The Fed mandates that banks hold a certain fraction of their checkable deposits as vault cash or deposits with the Fed. These reserve requirements are the last of the Fed’s three traditional monetary policy tools. The required reserve ratio is a determinant of the money multiplier in the money supply process.

During the financial crisis, the Fed introduced two new policy tools connected with bank reserve accounts that were still active in the fall of 2010:

1. Interest on reserve balances. In October 2008, the Fed introduced a new tool when it began for the first time to pay interest on banks’ required reserve and excess reserve deposits. Reserve requirements impose an implicit tax on banks because banks could otherwise receive interest on the funds by lending them out or by investing them.

The Fed reduces the size of this tax by paying interest on reserve balances. The Fed also gains a greater ability to influence banks’ reserve balances. By raising the interest rate it pays, the Fed can increase banks’ holdings of reserves, potentially restraining banks’ ability to extend loans and increase the money supply. By reducing the interest rate, the Fed can have the opposite effect.

2. Term deposit facility. In April 2010, the Fed announced that it would offer banks the opportunity to purchase term deposits, which are similar to the certificates of deposit that banks offer to households and firms. The Fed offers term deposits to banks in periodic auctions. The interest rates are determined by the auctions and have been slightly above the interest rate the Fed offers on reserve balances.

For example, in October 2010, the interest rate on the Fed’s auction of $5 billion in 28-day term deposits was 0.27%, which was higher than the interest rate of 0.25% the Fed was paying on reserve deposits. The term deposit facility gives the Fed another tool in managing bank reserve holdings. The more funds banks place in term deposits, the less they will have available to expand loans and the money supply.

BALANCE SHEET BASIC DEFINITION INFORMATION


What Is A Balance Sheet?

The Balance Sheet presents the financial position of a company at a given point in time. It is comprised of three parts: Assets, Liabilities, and Shareholder’s Equity.

Assets are the economic resources of a company. They are the resources that the company uses to operate its business and include Cash, Inventory, and Equipment. (Both financial statements and accounts in financial statements are capitalized.)

A company normally obtains the resources it uses to operate its business by incurring debt, obtaining new investors, or through operating earnings. The Liabilities section of the Balance Sheet presents the debts of the company.

Liabilities are the claims that creditors have on the company’s resources. The Equity section of the Balance Sheet presents the net worth of a company, which equals the assets that the company owns less the debts it owes to creditors.

In other words, equity is comprised of the claims that investors have on the company’s resources after debt is paid off. The most important equation to remember is that

Assets (A) = Liabilities (L) + Shareholder’s Equity (SE)
The structure of the Balance Sheet is based on that equation. This example uses the basic format of a Balance Sheet:


With respect to the right side of the balance sheet, because companies can obtain resources from both investors and creditors, they must distinguish between the two. Companies incur debt to obtain the economic resources necessary to operate their businesses and promise to pay the debt back over a specified period of time.

This promise to pay is based on a fixed payment schedule and is not based upon the operating performance of the company. Companies also seek new investors to obtain economic resources.

However, they don’t promise to pay investors back a specified amount over a specified period of time. Instead, companies forecast for a return on their investment that is often contingent upon assumptions the company or investor makes about the level of operating performance.

Since an equity holder’s investment is not guaranteed, it is more risky in nature than a loan made by a creditor. If a company performs well, the upside to investors is higher.

The promise-to-pay element makes loans made by creditors a Liability and, as an accountant would say, more “senior” than equity holdings, as it is paid back before distributions to equity-holders are made.

To summarize, the Balance Sheet represents the economic resources of a business. One side includes assets, the other includes liabilites (debt) and shareholder’s equity, and Assets = L+E.

On the liability side, debts owed to creditors are more senior than the investments of equity holders and are classified as Liabilities, while equity investments are accounted for in the Equity section of the Balance Sheet.

INVENTORY MANAGEMENT BASIC INFORMATION AND TUTORIALS


The three types of inventory are:

(1) raw materials, which are materials acquired from a supplier that will be used in the manufacture of goods;

(2) work-in-process, which is partially completed goods at the end of the accounting period; and

(3) finished goods, which are completed goods awaiting sale.

Inventory management involves a trade-off between the costs associated with keeping inventory versus the benefits of holding inventory. Higher inventory levels result in increased costs from storage, insurance, spoilage, and interest on borrowed funds needed to finance inventory acquisition.

However, an increase in inventory lowers the possibility of lost sales from stock outs and the incidence of production slowdowns from inadequate inventory. Further, large volume purchases will result in greater purchase discounts.

Inventory levels are also influenced by short-term interest rates. For example, as short-term interest rates increase, the optimum level of holding inventory will be reduced.

Inventory should be counted at regular, cyclic intervals because this provides the ability to check inventory on an ongoing basis as well as to reconcile the book and physical amounts. Cyclic counting has the following advantages:

1. It allows for an efficient use of a few full-time experienced counters throughout the year.

2. It enables the timely detection and correction of the causes of inventory error.

3. It does not require a plant shutdown, as does a year-end count.

4. It facilitates the modification of computer inventory programs if needed.


A quantity discount may be received when purchasing large orders. The discount serves as a reduction of the acquisition cost of materials.

MANAGEMENT OF ACCOUNTS RECEIVABLE BASIC INFORMATION AND TUTORIALS


Consideration should be given to the company’s investment in accounts receivable since there is an opportunity cost associated with holding receivable balances. The major decision regarding accounts receivable is the determination of the amount and terms of credit to extend to customers.

The credit terms offered have a direct bearing on the associated costs and revenue to be generated from receivables. For example, if credit terms are tight, there will be less of an investment in accounts receivable and less bad debt losses, but there will also be lower sales and reduced profits.

In evaluating a potential customer’s ability to pay, consideration should be given to the firm’s integrity, financial soundness, collateral to be pledged, and current economic conditions. A customer’s credit soundness may be evaluated through quantitative techniques such as regression analysis.

Such techniques are most useful when a large number of small customers are involved. Bad debt losses can be estimated reliably when a company sells to many customers and when its credit policies have not changed for a long period of time.

The collection period for accounts receivable partly depends on the firm’s credit policy and economic conditions, such as a recessionary environment, a period of limited or tight credit, or both. In managing accounts receivable, the following procedures are recommended.

First, establish a credit policy:

1. A detailed review of a potential customer’s soundness should be made prior to extending credit. Procedures such as a careful review of the customer’s financial statements and credit rating, as well as a review of financial service reports (e.g., Dun & Bradstreet), are common.

2. As customer financial health changes, credit limits should be revised.

3. Marketing factors must be noted since an excessively restricted credit policy will lead to lost sales.

4. If seasonal datings are used, the firm may offer more liberal payments than usual during slow periods in order to stimulate business by selling to customers who are unable to pay until later in the season. This policy is financially appropriate when the return on the additional sales plus the lowering in inventory costs is greater than the incremental cost associated with the additional investment in accounts receivable.

Second, establish a policy concerning billing:

1. Customer statements should be sent within 1 day subsequent to the close of the period.

2. Large sales should be billed immediately.

3. Customers should be invoiced for goods when the order is processed rather than when it is shipped.

4. Billing for services should be done on an interim basis or immediately prior to the actual services. The billing process will be more uniform if cycle billing is employed.

5. The use of seasonal datings should be considered. (See item 4, concerning credit policy.)

Finally, establish a policy concerning collection:

1. Accounts receivable should be aged in order to identify delinquent and high-risk customers. The aging should be compared to industry norms.

2. Collection efforts should be undertaken at the very first sign of customer financial unsoundness.

OPTIMAL CASH BALANCE BASIC INFORMATION AND TUTORIALS

HOW TO DETERMINE THE OPTIMAL CASH BALANCE?


There are two techniques for deciding how much cash to maintain at any given point, considering that both holding cash and investing it have both advantages and disadvantages. The purpose of cash models is to satisfy cash requirements at the least cost.


Baumol’s Model
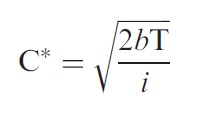
It attempts to determine the optimum cash balance under conditions of certainty. The objective is to minimize the sum of the fixed costs of transactions and the opportunity cost of holding cash balances.

These costs are expressed as:

b x (T/C) + (iC/2)


where b=the fixed cost of a transaction, T=the total cash needed for the time period involved, i=the interest rate on marketable securities, and C=cash balance. The optimal level of cash or the optimal cash balance is determined using the following formula:

EXAMPLE: You estimate a cash need for $4,000,000 over a 1-month period where the cash account is expected to be disbursed at a constant rate. The opportunity interest rate is 6 percent per annum or 0.5 percent for a 1-month period. The transaction cost each time you borrow or withdraw is $100.

The optimal cash balance and the number of transactions you should make during the month follow:


The optimal cash balance is $400,000. The average cash balance is:
C/2 = $400,000/2 = $200,000

The number of transactions required are:
$4,000,000/$400,000 = 10 transactions during the month:


The Miller–Orr Model
The Miller–Orr model is a stochastic model for cash management where uncertainty exists for cash payments. In other words, there is irregularity of cash payments. The Miller–Orr model places an upper and lower limit for cash balances.

When the upper limit is reached a transfer of cash to marketable securities or other suitable investments is made. When the lower limit is reached a transfer from securities to cash occurs. A transaction will not occur as long as the cash balance falls within the limits.

The Miller–Orr model takes into account the fixed costs of a securities transaction (b), assumed to be the same for buying as well as selling, the daily interest rate on marketable securities (i), and the variance of daily net cash flows. A major assumption is the randomness of cash flows.

The two control limits in the Miller–Orr model may be specified as ‘‘h’’ dollars as an upper limit and zero dollars at the lower limit. When the cash balance reaches the upper level, h less z dollars of securities are bought and the new balance equals zero, and z dollars of securities are sold and the new balance again reaches z.

The optimal cash balance z is computed as follows:

The optimal value for h is computed as 3z. The average cash balance will approximate (z+h)/3


DELAY OF CASH OUTFLOW BASIC INFORMATION AND TUTORIALS


There are various ways to delay cash disbursements, including:

1. Using drafts to pay bills since drafts are not due on demand. When a bank receives a draft it must return the draft to the issuer for acceptance prior to payment. When the company accepts the draft, it then deposits the required funds with the bank; hence, a smaller average checking balance is maintained.

2. Mailing checks from post offices having limited service or from locations where the mail must go through several handling points, lengthening the payment period.

3. Drawing checks on remote banks or establishing cash disbursement centers in remote locations so that the payment period is lengthened. For example, someone in New York can be paid with a check drawn on a California bank.

4. Using credit cards and charge accounts in order to lengthen the time between the acquisition of goods and the date of payment for those goods.

5. Disbursing sales commissions when the receivables are collected rather than when the sales are made.

6. Maintaining a zero balance account (ZBA) where zero balances are established for all of the company’s disbursing units. These accounts are in the same concentration bank.

Checks are drawn against these accounts, with the balance in each account never exceeding $0. Divisional disbursing authority is thus maintained at the local level of management.

The advantages of zero balance accounts are better control over cash payments, reduction in excess cash balances held in regional banks, and a possible increase in disbursing float.

7. Using a controlled disbursement account. With this system, almost all payments that must be made are known in the morning. The bank informs the firm of the total, and the firm transfers (usually by wire) the amount needed.

SALES BUDGET BASIC INFORMATION AND TUTORIALS

HOW TO MAKE A SALES BUDGET - FINANCE


The sales budget is the starting point in preparing the operating budget, since estimated sales volume influences almost all other items appearing throughout the annual budget. The sales budget gives the quantity of each product expected to be sold.

Basically, there are three ways of making estimates for the sales budget:

1. Make a statistical forecast (using any one or a combination of the methods on the basis of an analysis of general business conditions, market conditions, product growth curves, etc.

2. Make an internal estimate by collecting the opinions of executives and sales staff.

3. Analyze the various factors that affect sales revenue and then predict the future behavior of each of those factors.

After sales volume has been estimated, the sales budget is constructed by multiplying the estimated number of units by the expected unit price. Generally, the sales budget includes a computation of cash collections anticipated from credit sales, which will be used later for cash budgeting.

See Example Below:


Assume that of each quarter’s sales, 70 percent is collected in the first quarter of the sale; 28 percent
is collected in the following quarter; and 2 percent is uncollectible.


The Johnson Company
Sales Budget
For the Year Ended December 31, 20X2

(click to enlarge)

Schedule of Expected Cash Collections


ACCELERATION OF CASH FLOW MANAGEMENT BASIC INFORMATION AND TUTORIALS


To accelerate cash inflow, the financial manager must (1) know the bank’s policy regarding fund availability; (2) know the source and location of company receipts; and (3) devise procedures for quick deposit of checks received and quick transfer of receipts in outlying accounts into the main corporate account.

The various types of check processing delays that must be analyzed are: (1) mail float—the time required for a check to move from a debtor to a creditor; (2) processing float—the time it takes for a creditor to deposit the check after receipt; and (3) deposit collection float—the time required for a check to clear.

Note: Electronic data exchange (EDI), or financial EDI (FEDI), significantly reduces or eliminates a float. EDI refers to the growing practice of direct, electronic information exchange between all types of businesses, thereby shortening the length of time required to initiate and complete a business transaction.

Mail float can be minimized by having the collection center located near the customer. Local banks should be selected to speed the receipt of funds for subsequent transfer to the central corporate account.

As an alternative, strategic post office lockboxes may be used for customer remissions. The local bank collects from these boxes periodically during the day and deposits the funds in the corporate account.

The bank also furnishes the company with a computer listing of payments received by account and a daily total. Because the lockbox system has a significant per-item cost, it is most cost-effective with low-volume, high-dollar remissions.

However, the system is becoming increasingly more available to companies with high-volume, low-dollar deposits as technological advances (such as machine-readable documents) lower the per-item cost of lock boxes.


Before a lockbox system is implemented, the company should make a cost–benefit analysis that considers the average dollar amount of checks received, the costs saved by having lock boxes, the reduction in mailing time per check, and the processing cost.

CASH MANAGEMENT BASIC DEFINITION AND TUTORIALS


What Is Cash? How To Manage Cash?

Cash refers to currency and demand deposits. Cash management involves having the optimum, neither excessive nor deficient, amount of cash on hand at the right time. Proper cash management requires that the company know how much cash it needs, as well as how much it has and where that cash is at all times.

This is especially essential in an inflationary environment. The objective of cash management is to invest excess cash for a return while retaining sufficient liquidity to satisfy future needs. The financial manager must plan when to have excess funds available for investment and when money needs to be borrowed.

The amount of cash to be held depends upon the following factors:
1. Cash management policies
2. Current liquidity position
3. Management’s liquidity risk preferences
4. Schedule of debt maturity
5. The firm’s ability to borrow
6. Forecasted short- and long-term cash flow
7. The probabilities of different cash flows under varying circumstances

The company should not have an excessive cash balance since no return is being earned upon it. The least amount of cash a firm should hold is the greater of (1) compensating balances (a deposit held by a bank to compensate it for providing services) or (2) precautionary balances (money held for emergency purposes) plus transaction balances (money needed to cover checks outstanding).

Cash management also requires knowing the amount of funds available for investment and the length of time for which they can be invested. A firm may invest its funds in the following:

1. Time deposits, including savings accounts earning daily interest, long-term savings accounts, and certificates of deposit

2. Money market funds, which are managed portfolios of short-term, high-grade debt instruments such as Treasury bills and commercial paper

3. Demand deposits that pay interest

4. U.S. Treasury securities


When cash receipts and disbursements are highly synchronized and predictable, a firm may keep a small cash balance. The financial manager must accurately forecast the amount of cash needed, its source, and its destination. These data are needed on both a short- and a long-term basis.

Forecasting assists the manager in properly timing financing, debt repayment, and the amount to be transferred between accounts.

In deciding whether to adopt a cash management system, the financial manager should consider its associated costs versus the return earned from implementation of the system. Costs related to cash management systems include bank charges, financial manager’s time, and office employee salaries.

Some cash management systems use the firm’s computer to make transactions with the computers of banks and money market funds. Computer systems are also useful for purchasing and selling securities in the money market.

Companies with many bank accounts should guard against accumulating excessive balances. Less cash needs to be kept on hand when a company can borrow quickly from a bank, such as under a line of credit agreement, which permits a firm to borrow instantly up to a specified maximum amount. A company may also find some cash unnecessarily tied up in other accounts, such as advances to employees. Excess cash should be invested in marketable securities for a return.

Note, however, that cash in some bank accounts may not be available for investment. For instance, when a bank lends money to a company, the bank often requires the company to keep funds on hand as collateral. This deposit is called a compensating balance, which in effect represents restricted cash for the company.

Holding marketable securities serves as protection against cash shortages. Companies with seasonal operations may buy marketable securities when they have excess funds and then sell the securities when cash deficits occur.

A firm may also invest in marketable securities when funds are being held temporarily in anticipation of short term capital expansion. In selecting an investment portfolio, consideration should be given to return, default risk, marketability, and maturity date.

The thrust of cash management is to accelerate cash receipts and delay cash payments. Each bank account should be analyzed as to its type, balance, and cost so that corporate return is maximized.

MANAGING NET WORKING CAPITAL BASIC INFORMATION AND TUTORIALS


Working capital is equal to current assets. Net working capital is equal to current assets less current liabilities.

EXAMPLE Ace Company has the following selected assets and liabilities:
Cash $10,000
Accounts receivable $30,000
Inventory $42,000
Machinery $90,000
Long-term investments $36,000
Patent $4,000
Accounts payable $12,000
Taxes payable $3,000
Accrued expenses payable $5,000
Bonds payable $50,000
Common stock $70,000
The net working capital is:

CURRENT ASSETS
Cash $10,000
Accounts receivable 30,000
Inventory 42,000 $82,000

CURRENT LIABILITIES
Accounts payable $12,000
Taxes payable 3,000
Accrued expenses payable 5,000 20,000
Net working capital $62,000

Management of net working capital involves regulating the various types of current assets and current liabilities. Management of net working capital also requires decisions about how current assets should be financed, for example, through short-term debt, long-term debt, or equity.

Net working capital is increased when current assets are financed through noncurrent sources. The liquidity of current assets will affect the terms and availability of short-term credit. The greater the liquidity, the easier it becomes, generally, to obtain a short-term loan at favorable terms. Short-term credit, in turn, affects the amount of cash balance held by a firm.


Working Capital Management and Risk-Return Trade-Off
The management of net working capital requires consideration for the trade-off between return and risk. Holding more current than fixed assets means a reduced liquidity risk. It also means greater flexibility, since current assets may be modified easily as sales volume changes.

However, the rate of return will be less with current assets than with fixed assets. Fixed assets typically earn a greater return than current assets. Long-term financing has less liquidity risk associated with it than short term debt, but it also carries a higher cost.


For example, when a company needs funds to purchase seasonal or cyclical inventory, it uses short term, not long-term financing. The short-term debt gives the firm flexibility to meet its seasonal needs within its ability to repay the loan.

On the other hand, the company’s permanent assets should be financed with long-term debt. Because the assets last longer, the financing can be spread over a longer time. Liquidity risk may be reduced by using the hedging approach to financing, in which assets are financed by liabilities with similar maturity

THE STRUCTURE OF THE BUDGET BASIC INFORMATION AND TUTORIALS


The budget is classified broadly into two categories: the operational budget, which reflects the results of operating decisions; and the financial budget, which reflects the financial decisions of the firm.

The operating budget consists of:

1. Sales budget, including a computation of expected cash receipts
2. Production budget
3. Ending inventory budget
4. Direct materials budget, including a computation of expected cash disbursements for materials
5. Direct labor budget
6. Factory overhead budget
7. Selling and administrative expense budget
8. Pro forma income statement


The financial budget consists of:

1. Cash budget
2. Pro forma balance sheet

The major steps in preparing the budget are:

1. Prepare a sales forecast
2. Determine production volume
3. Estimate manufacturing costs and operating expenses
4. Determine cash flow and other financial effects
5. Formulate projected financial statements


PERCENT-OF-SALES METHOD OF FINANCIAL FORECASTING


When constructing a financial forecast, the sales forecast is used traditionally to estimate various expenses, assets, and liabilities. The most widely used method for making these projections is the percent of- sales method, in which the various expenses, assets, and liabilities for a future period are estimated as a percentage of sales.

These percentages, together with the projected sales, are then used to construct pro forma (planned or projected) balance sheets.

The calculations for a pro forma balance sheet are as follows:

1. Express balance sheet items that vary directly with sales as a percentage of sales. Any item that does not vary directly with sales (such as long-term debt) is designated not applicable (n.a.).

2. Multiply the percentages determined in step 1 by the sales projected to obtain the amounts for the future period.

3. Where no percentage applies (such as for long-term debt, common stock, and capital surplus), simply insert the figures from the present balance sheet in the column for the future period.

4. Compute the projected retained earnings as follows:
Projected retained earnings ¼ present retained earnings
รพ projected net income cash dividends paid
(You will need to know the percentage of sales that constitutes net income and the dividend payout ratio.)

5. Sum the asset accounts to obtain a total projected assets figure. Then add the projected liabilities and equity accounts to determine the total financing provided. Since liability plus equity must balance the assets when totaled, any difference is a shortfall, which is the amount of external financing needed.


One important limitation of the percent-of-sales method is that the firm is assumed to be operating at full capacity. On the basis of this assumption, the firm does not have sufficient productive capacity to absorb projected increases in sales and thus requires an additional investment in assets.

The major advantage of the percent-of-sales method of financial forecasting is that it is simple and inexpensive to use. To obtain a more precise projection of the firm’s future financing needs, however, the preparation of a cash budget is required.

Leverage (Solvency, Long-Term Debt) Ratios Basic Information and Tutorials


Solvency is a company’s ability to meet it long-term obligations as they become due. An analysis of solvency concentrates on the long-term financial and operating structure of the business.

The degree of long-term debt in the capital structure is also considered. Further, solvency is dependent upon profitability since in the long run a firm will not be able to meet its debts unless it is profitable.

When debt is excessive, additional financing should be obtained primarily from equity sources. Management might also consider lengthening the maturity of the debt and staggering the debt repayment dates.

Some leverage ratios follow.

Debt Ratio. The debt ratio compares total liabilities (total debt) to total assets. It shows the percentage of total funds obtained from creditors.

Creditors would rather see a low debt ratio because there is a greater cushion for creditor losses if the firm goes bankrupt.

Debt ratio = total liabilities/ total assets

For the Ratio Company, in 20X3 the debt ratio is: $135,400/ $220,000 = 0:62

In 20X2, the ratio was 0.63. There was a slight improvement in the ratio over the year as indicated by the lower degree of debt to total assets.

FINANCIAL STATEMENT ANALYSIS BASIC INFORMATION AND TUTORIALS


The financial statements of an enterprise present the summarized data of its assets, liabilities, and equities in the balance sheet and its revenue and expenses in the income statement. If not analyzed, such data may lead one to draw erroneous conclusions about the firm’s financial condition.

Various measuring instruments may be used to evaluate the financial health of a business, including horizontal, vertical, and ratio analyses. A financial analyst uses the ratios to make two types of comparisons:

1. Industry comparison. The ratios of a firm are compared with those of similar firms or with industry averages or norms to determine how the company is faring relative to its competitors.

Industry average ratios are available from a number of sources, including:
a. Risk Management Association (RMA). RMA (formerly known as Robert Morris Associate) has been compiling statistical data on financial statements for more than 75 years. The RMA Annual Statement Studies provide statistical data from more than 150,000 actual companies on many key financial ratios, such as gross margin, operating margins, and return on equity and assets.

If you are looking to put real authority into the ‘‘industry average’’ numbers that your company is beating, the Statement Studies are the way to go. They are organized by SIC codes, and you can buy the financial statement studies for your industry in report form or over the Internet (www.rmahq.org).

b. Dun and Bradstreet. Dun and Bradstreet publishes Industry Norms and Key Business Ratios, which covers over 1 million firms in over 800 lines of business.

c. Value Line. Value Line Investment Service provides financial data and rates stocks of over 1,700 firms.

d. The Department of Commerce. The Department of Commerce Financial Report provides financial statement data and includes a variety of ratios and industrywide common-size vertical financial statements.

e. Others. Standard and Poor’s, Moody’s Investment Service, and various brokerate compile industry studies. Further, numerous online services such as Yahoo! and MSN Money Central, to name a few, also provide these data.

2. Trend analysis. A firm’s present ratio is compared with its past and expected future ratios to determine whether the company’s financial condition is improving or deteriorating over time.

After completing the financial statement analysis, the firm’s financial analyst will consult with management to discuss their plans and prospects, any problem areas identified in the analysis, and possible solutions.